|
||||||||||||||||||||
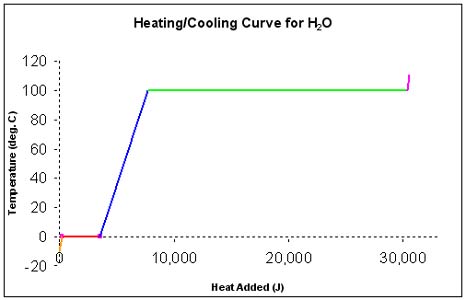
For instance, this curve (graph) shows the temperature behavior for H2O as it is heated from -10°C to 110°C (at standard atmospheric pressure). Notice that during melting (0°C, red line) and boiling (100°C, green line) the temperature does not increase or decrease.